The goal of BioVizSeq is to visualize the types and distribution of elements within bio-sequences. At the same time, We have developed a geom layer, geom_rrect(), that can generate rounded rectangles. No external references are used in the development of this package.
Install from CRAN:
# Install from CRAN
install.packages("BioVizSeq")
Install from Github: the development version of BioVizSeq:
install.packages("devtools")
devtools::install_github("zhaosq2022/BioVizSeq")library(BioVizSeq)
#> Registered S3 methods overwritten by 'treeio':
#> method from
#> MRCA.phylo tidytree
#> MRCA.treedata tidytree
#> Nnode.treedata tidytree
#> Ntip.treedata tidytree
#> ancestor.phylo tidytree
#> ancestor.treedata tidytree
#> child.phylo tidytree
#> child.treedata tidytree
#> full_join.phylo tidytree
#> full_join.treedata tidytree
#> groupClade.phylo tidytree
#> groupClade.treedata tidytree
#> groupOTU.phylo tidytree
#> groupOTU.treedata tidytree
#> inner_join.phylo tidytree
#> inner_join.treedata tidytree
#> is.rooted.treedata tidytree
#> nodeid.phylo tidytree
#> nodeid.treedata tidytree
#> nodelab.phylo tidytree
#> nodelab.treedata tidytree
#> offspring.phylo tidytree
#> offspring.treedata tidytree
#> parent.phylo tidytree
#> parent.treedata tidytree
#> root.treedata tidytree
#> rootnode.phylo tidytree
#> sibling.phylo tidytree
#> Package BioVizSeq loaded successfully!
# Extra package
library(ggplot2)
#> Warning: 程辑包'ggplot2'是用R版本4.3.3 来建造的gff or gtf file
gff_path <- system.file("extdata", "idpro.gff3", package = "BioVizSeq")
gff_data <- read.table(gff_path, header = FALSE, sep = '\t')
gff_loc <- gff_to_loc(gff_data)

motif_plot(gff_loc$table_loc, gff_loc$gene_length) +
    labs(x="DNA length (5'-3')", y="Gene name")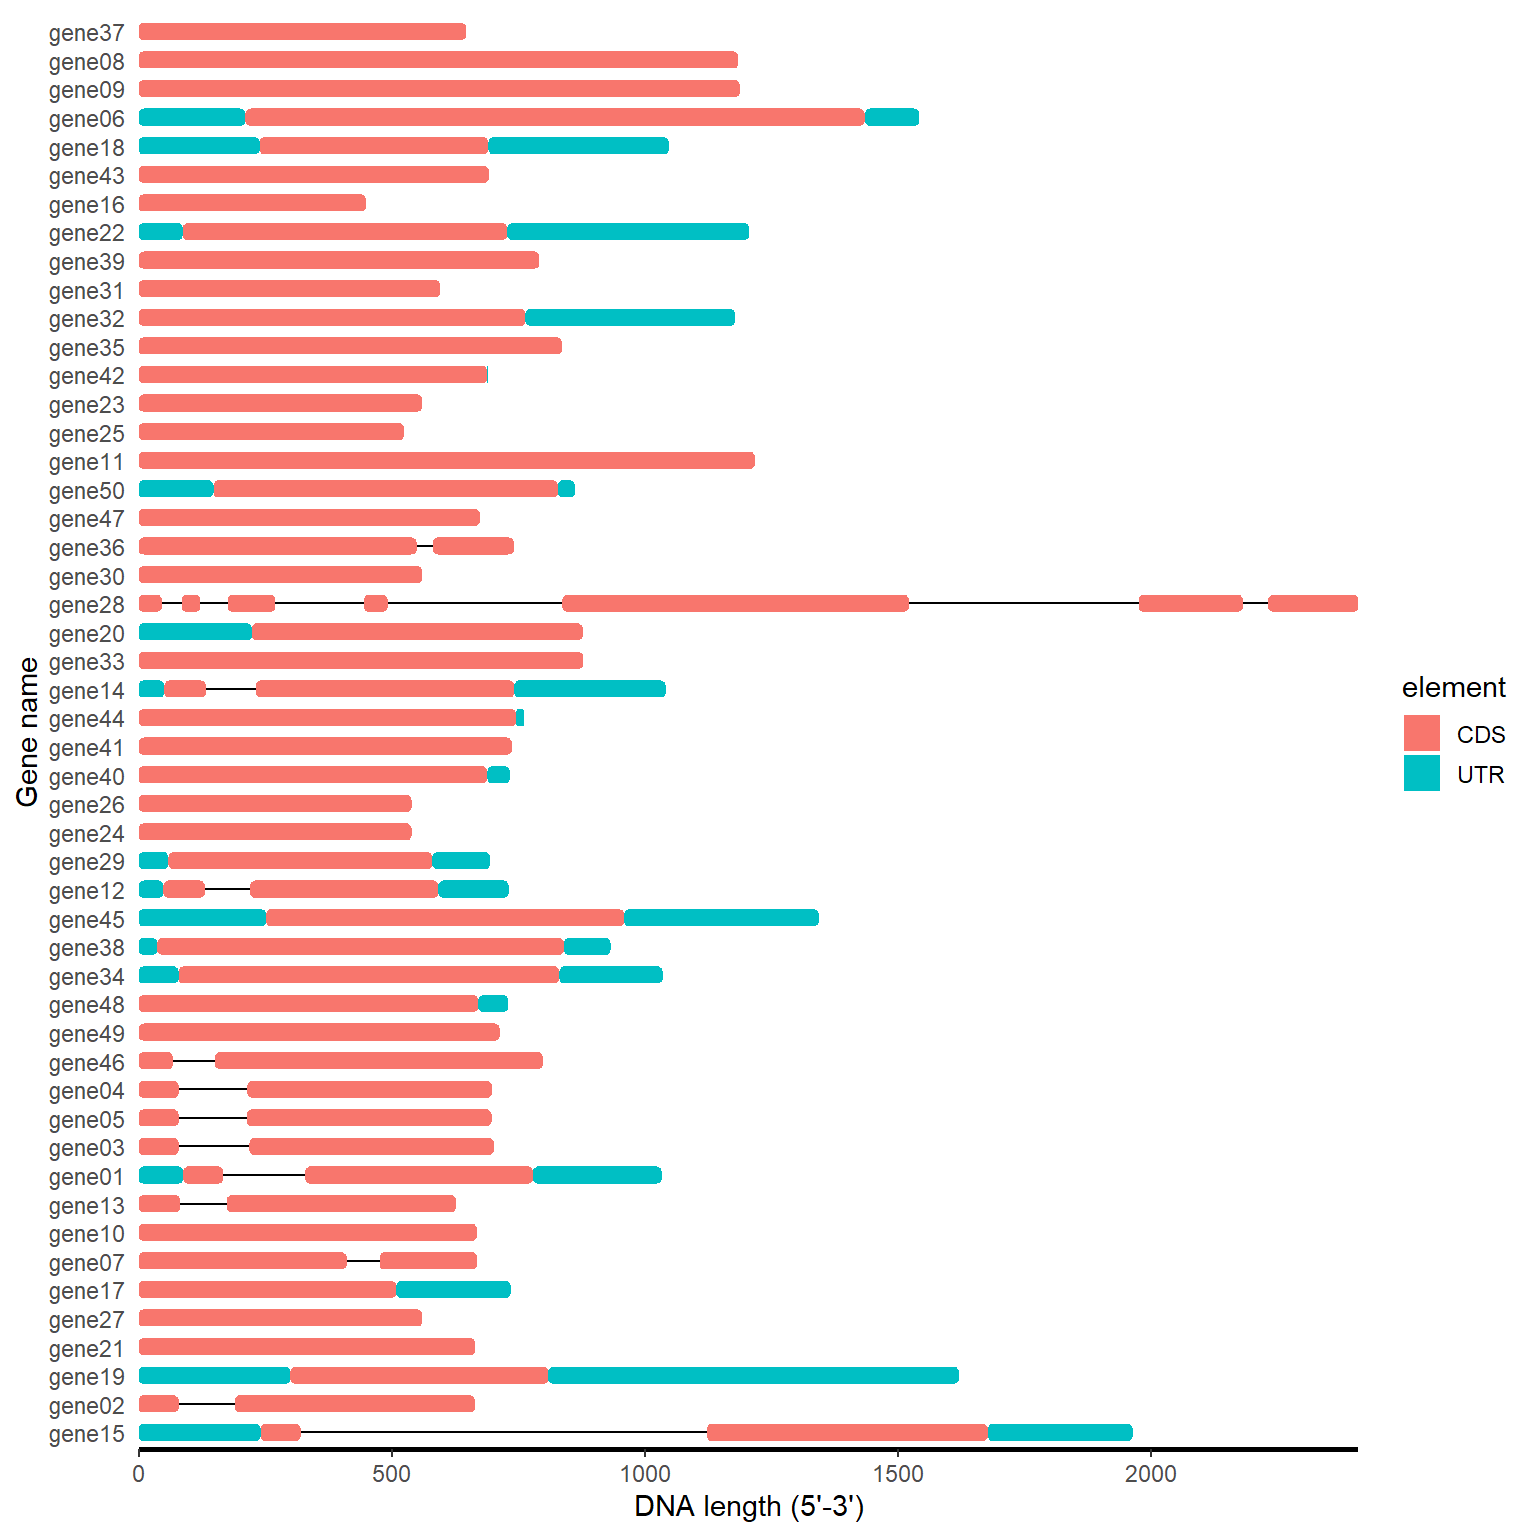
gff_path <- system.file("extdata", "idpro.gff3", package = "BioVizSeq")
gff_plot(gff_path)
meme.xml or mast.xml
meme_path <- system.file("extdata", "mast.xml", package = "BioVizSeq")
meme_file <- readLines(meme_path)
motif_loc <- meme_to_loc(meme_file)

motif_plot(motif_loc$table_loc, motif_loc$gene_length)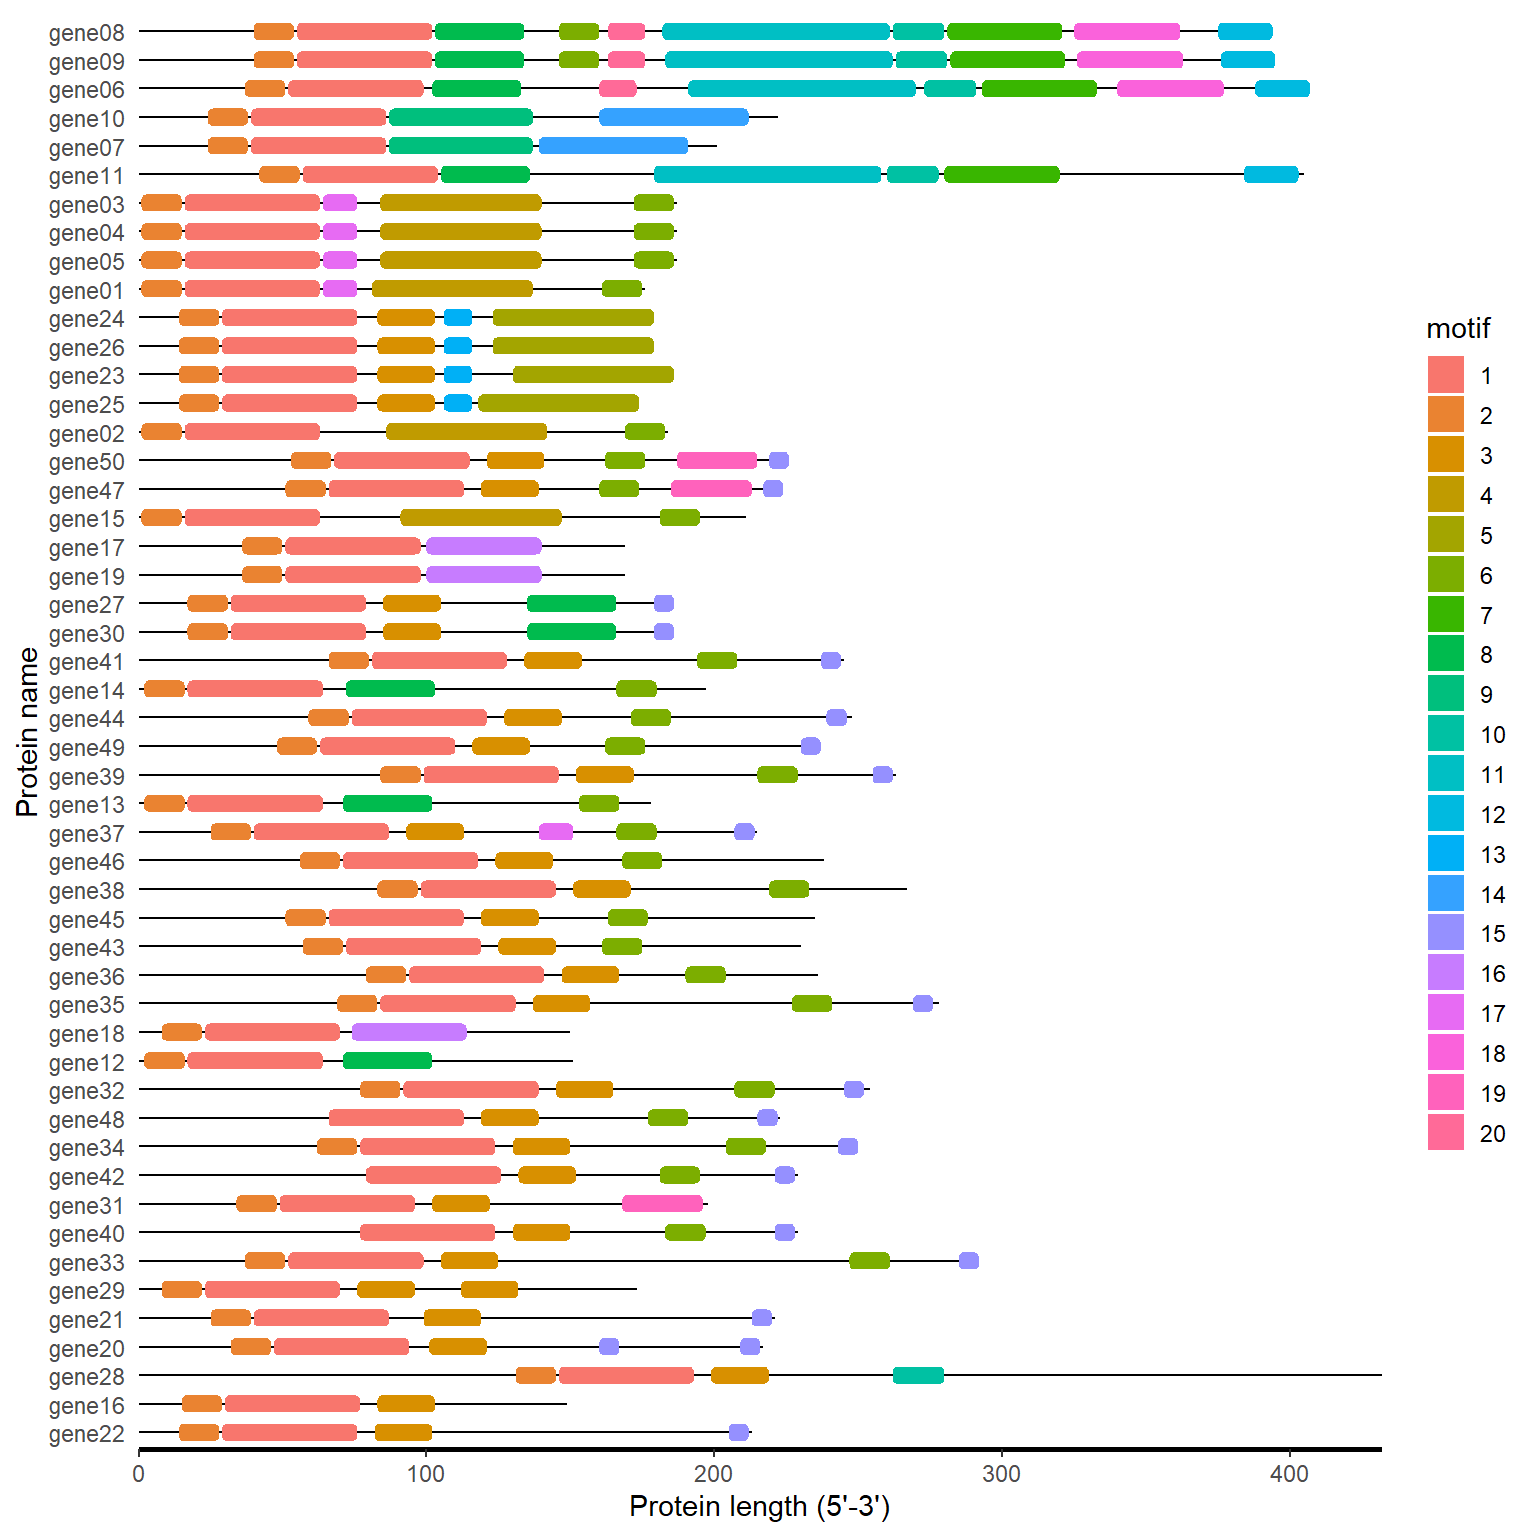
meme_path <- system.file("extdata", "mast.xml", package = "BioVizSeq")
meme_plot(meme_path)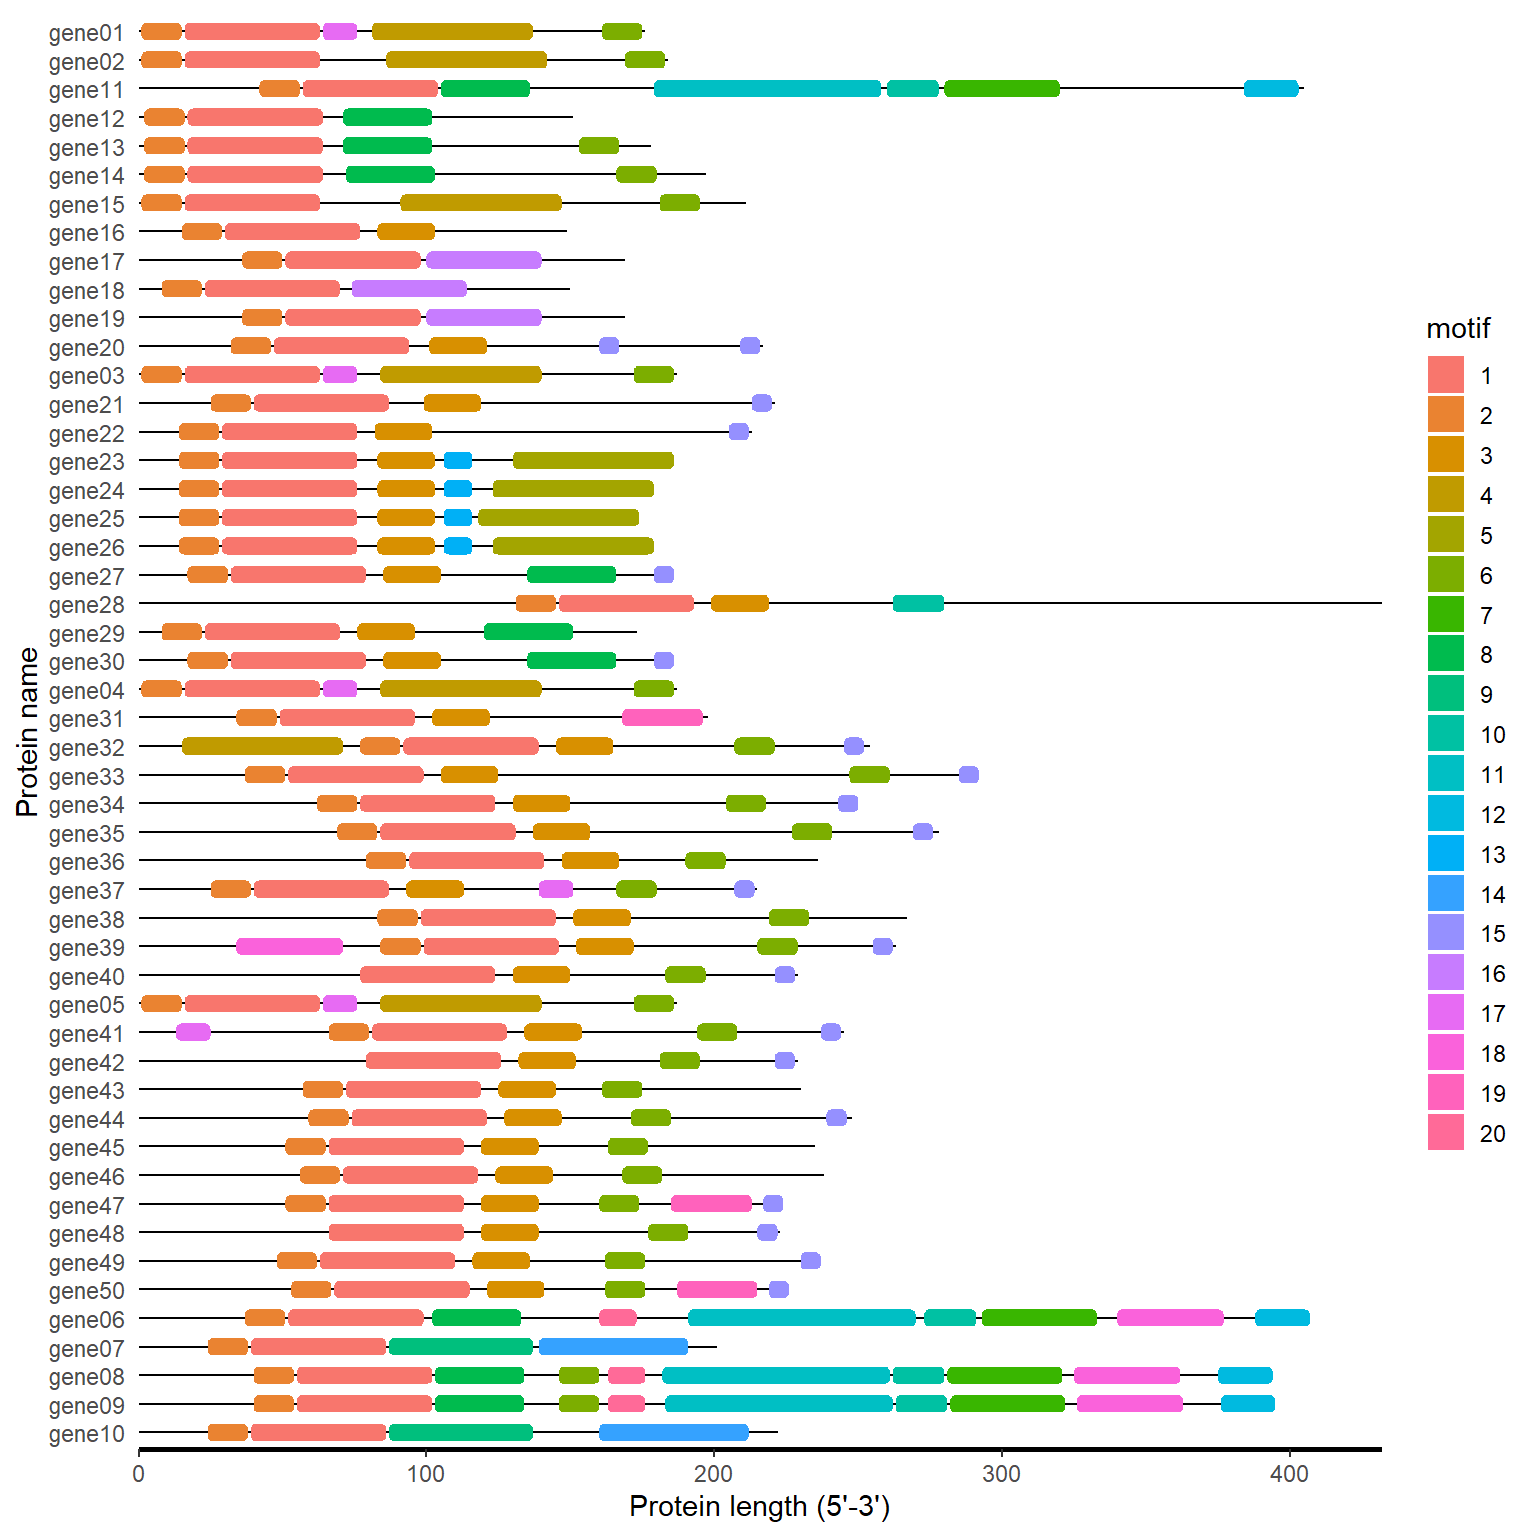
Download: .tsv
pfam_path <- system.file("extdata", "iprscan.tsv", package = "BioVizSeq")
pfam_file <- read.table(pfam_path, sep='\t', header = FALSE)
domain_loc <- pfam_to_loc(pfam_file)

motif_plot(domain_loc$table_loc, domain_loc$gene_length)
pfam_path <- system.file("extdata", "iprscan.tsv", package = "BioVizSeq")
pfam_plot(pfam_path)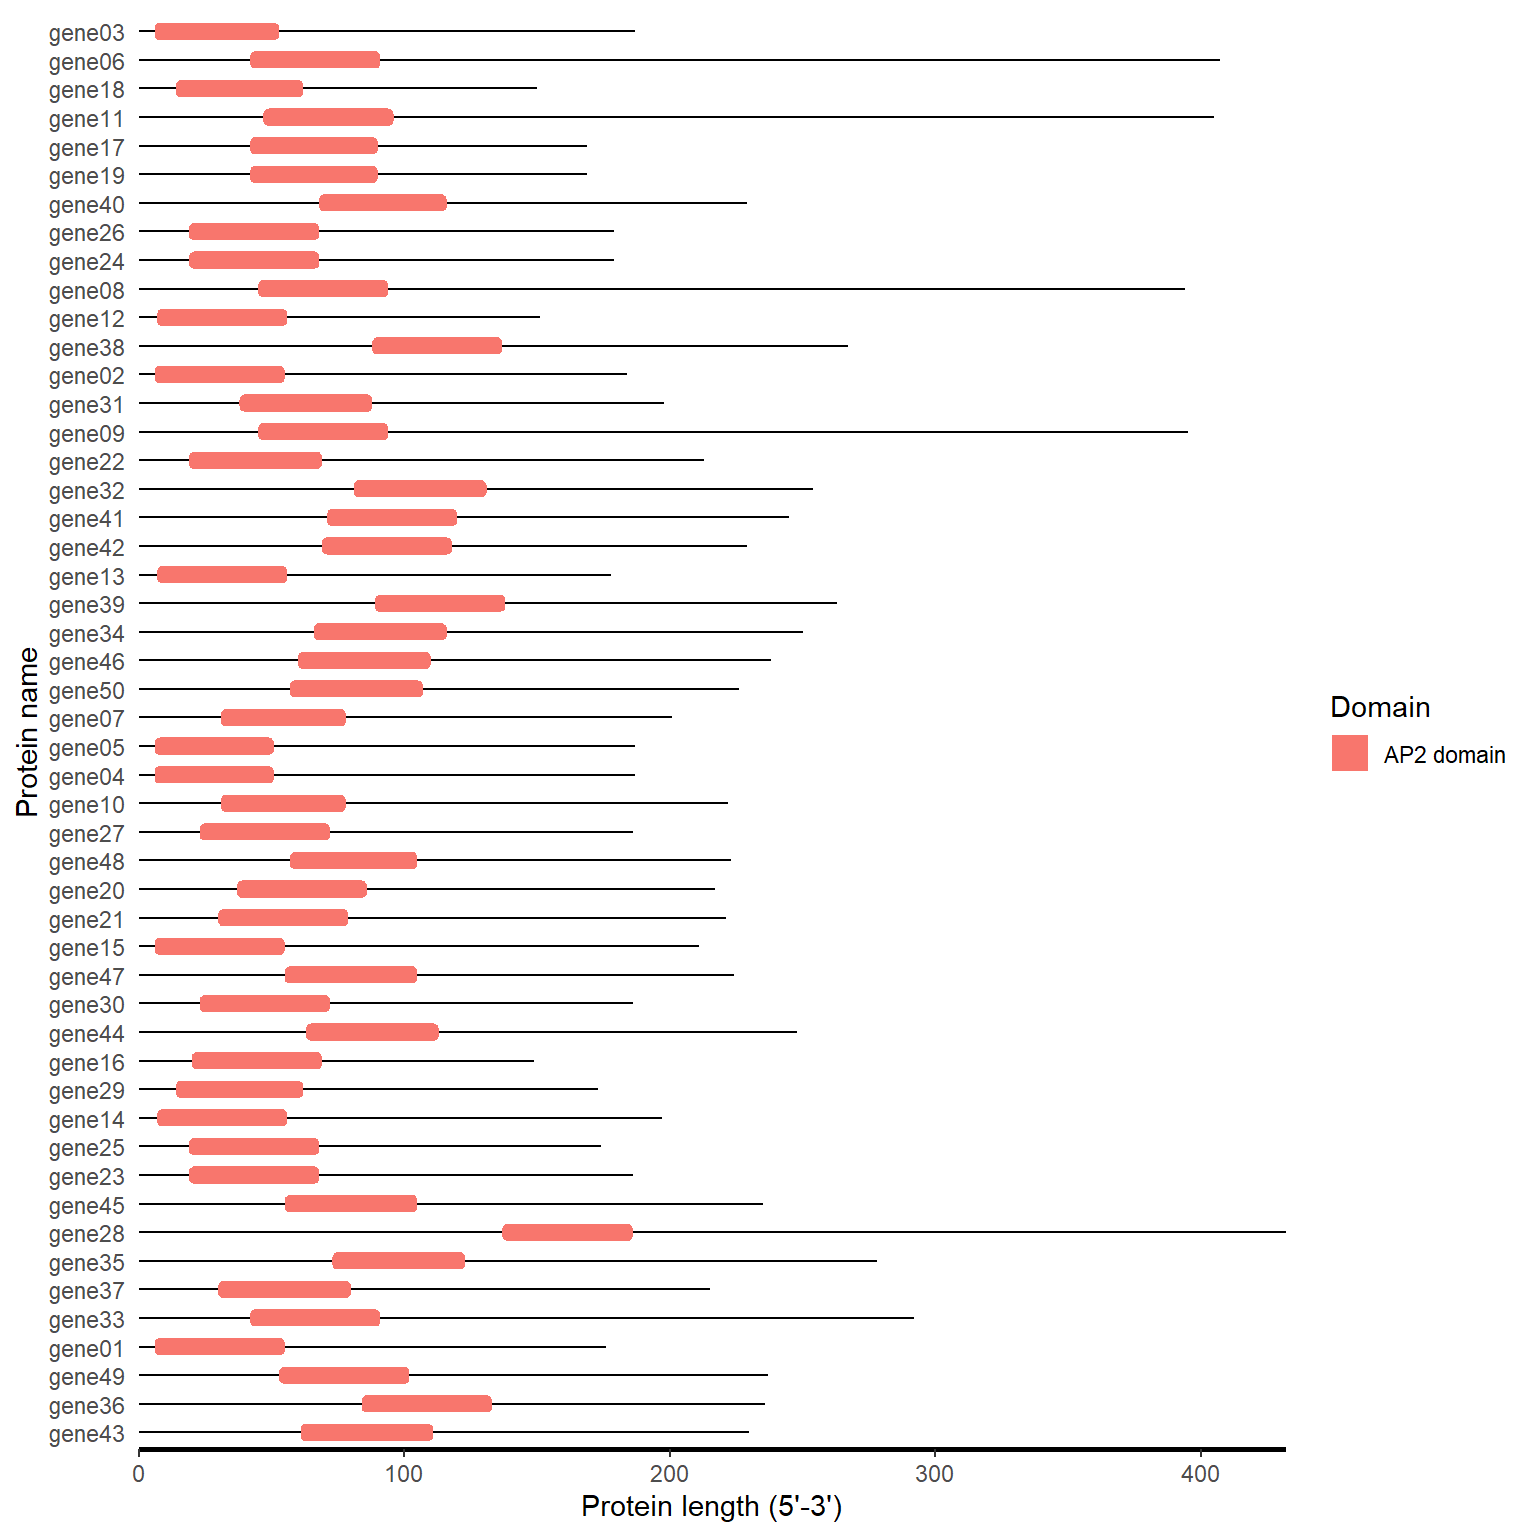
Download “Superfamily Only”
Type: .txt
hitdata_path <- system.file("extdata", "hitdata.txt", package = "BioVizSeq")
cdd_file <- readLines(hitdata_path)
domain_loc <- cdd_to_loc(cdd_file)

fa_path <- system.file("extdata", "idpep.fa", package = "BioVizSeq")
gene_length <- fastaleng(fa_path)
motif_plot(domain_loc, gene_length)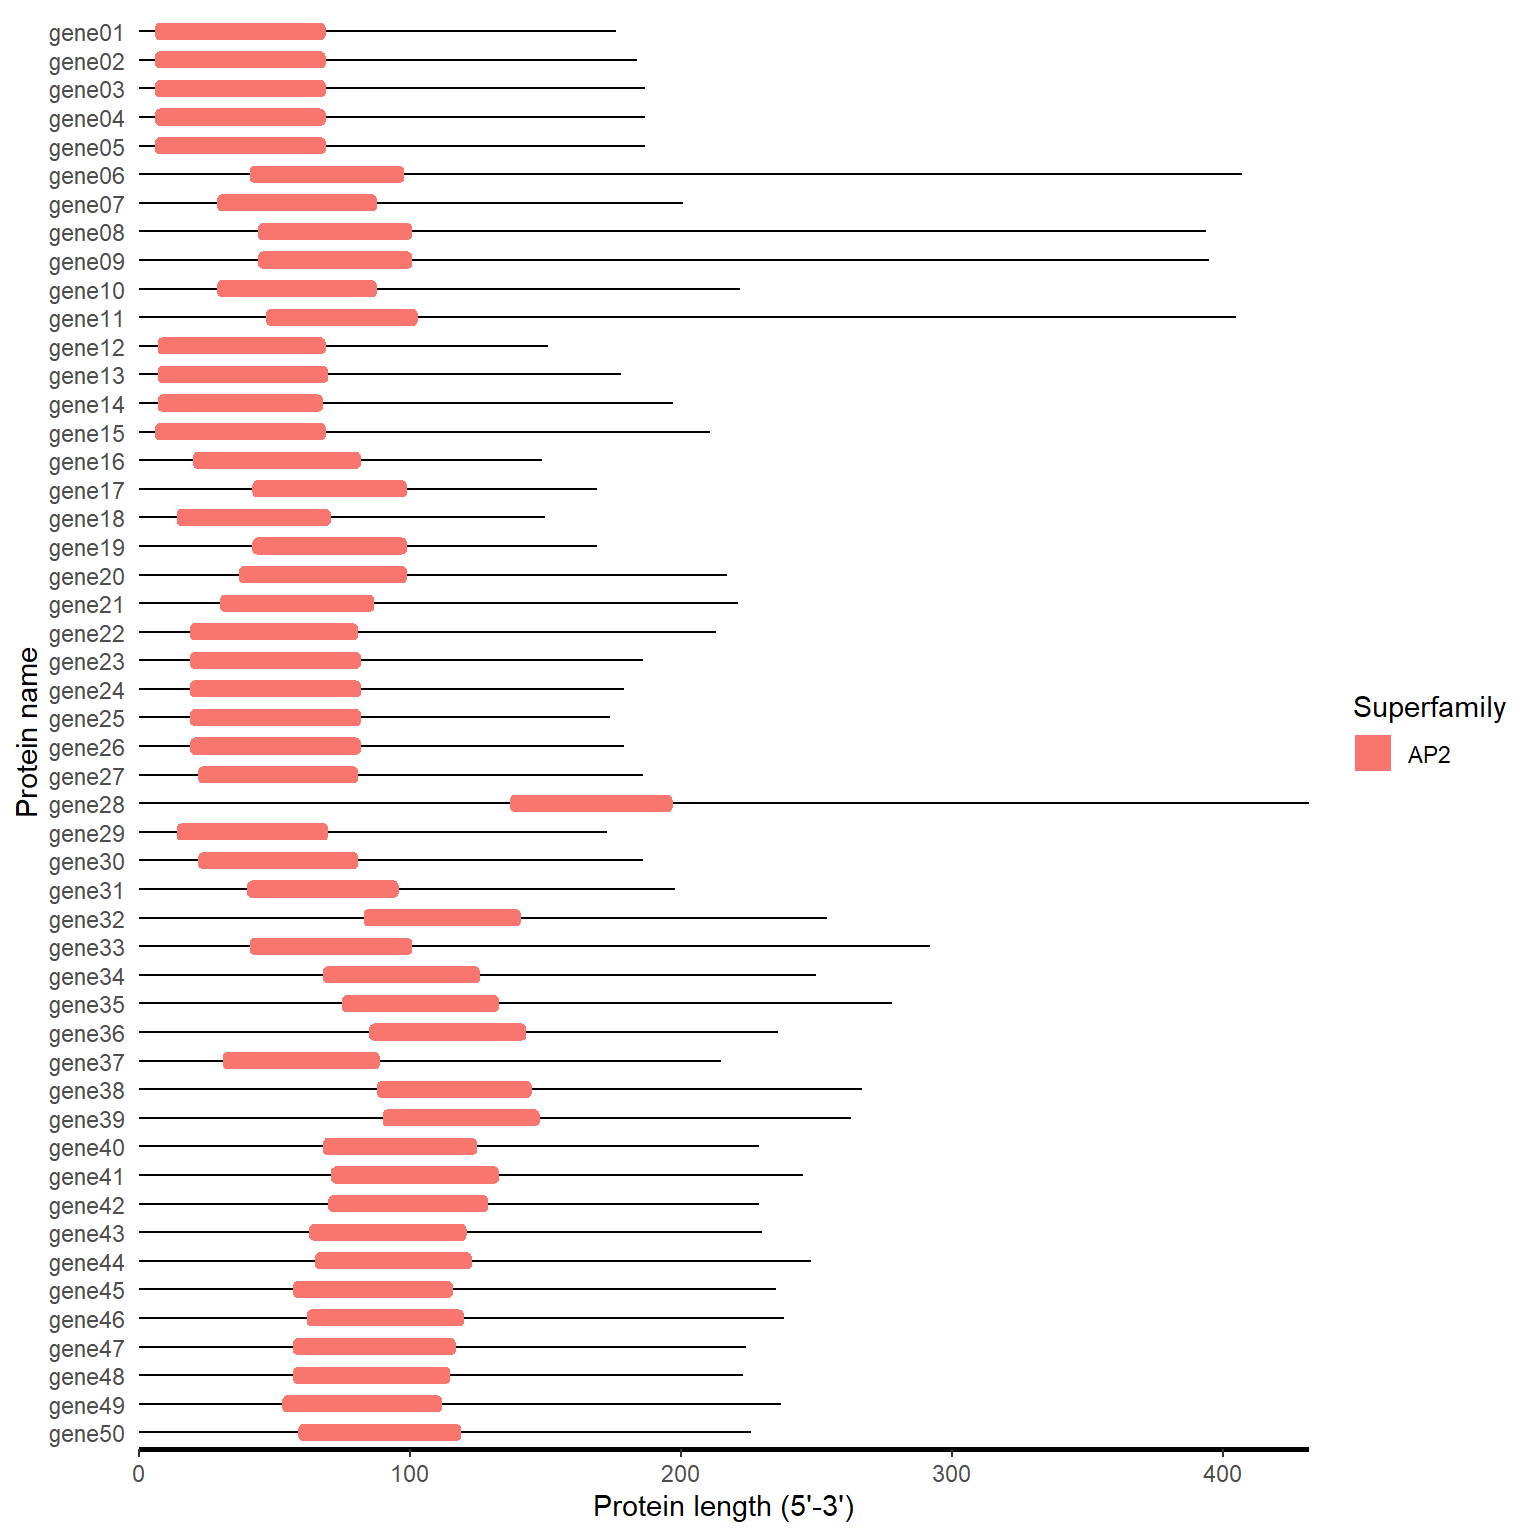
hitdata_path <- system.file("extdata", "hitdata.txt", package = "BioVizSeq")
fa_path <- system.file("extdata", "idpep.fa", package = "BioVizSeq")

cdd_plot(hitdata_path, fa_path)
protein file (.fa or .fasta)
fa_path <- system.file("extdata", "target.fa", package = "BioVizSeq")
domain_loc <- smart_to_loc(fa_path)
#> Submitting sequence AtAP2_002...
#> Submitting sequence AtAP2_003...
#> Job entered the queue with ID12315310532459281744966748fjuQJesKfo. Waiting for results.
#> Submitting sequence AtAP2_004...
#> Submitting sequence AtAP2_005...

motif_plot(domain_loc$table_loc, domain_loc$gene_length)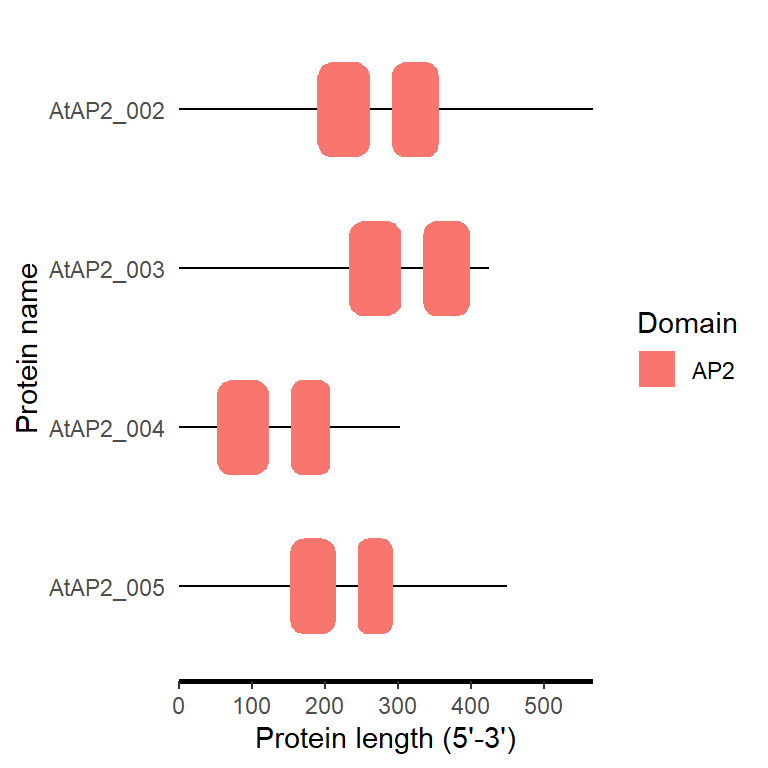
fa_path <- system.file("extdata", "target.fa", package = "BioVizSeq")

smart_plot(fa_path)
#> Submitting sequence AtAP2_002...
#> Submitting sequence AtAP2_003...
#> Job entered the queue with ID12315310532468761744966784YObRQLBBcV. Waiting for results.
#> Submitting sequence AtAP2_004...
#> Submitting sequence AtAP2_005...
promoter sequence(.fa or .fasta)
# 1. upload fasta file to plantcare, get the result file(.tab)
# upload_fa_to_plantcare(fasta_file, email)

# 2. Classify the functions of cis element

plantcare_path <- system.file("extdata", "plantCARE_output.tab", package = "BioVizSeq")
plantcare_file <- read.table(plantcare_path, header = FALSE, sep = '\t', quote="")
plantcare_data <- plantcare_classify(plantcare_file)
plantcare_loc <- plantcare_to_loc(plantcare_data)

promoter_length <- data.frame(ID = unique(plantcare_loc$ID), length=2000)

motif_plot(plantcare_loc, promoter_length) +
    labs(x="Promoter Length", y="Gene")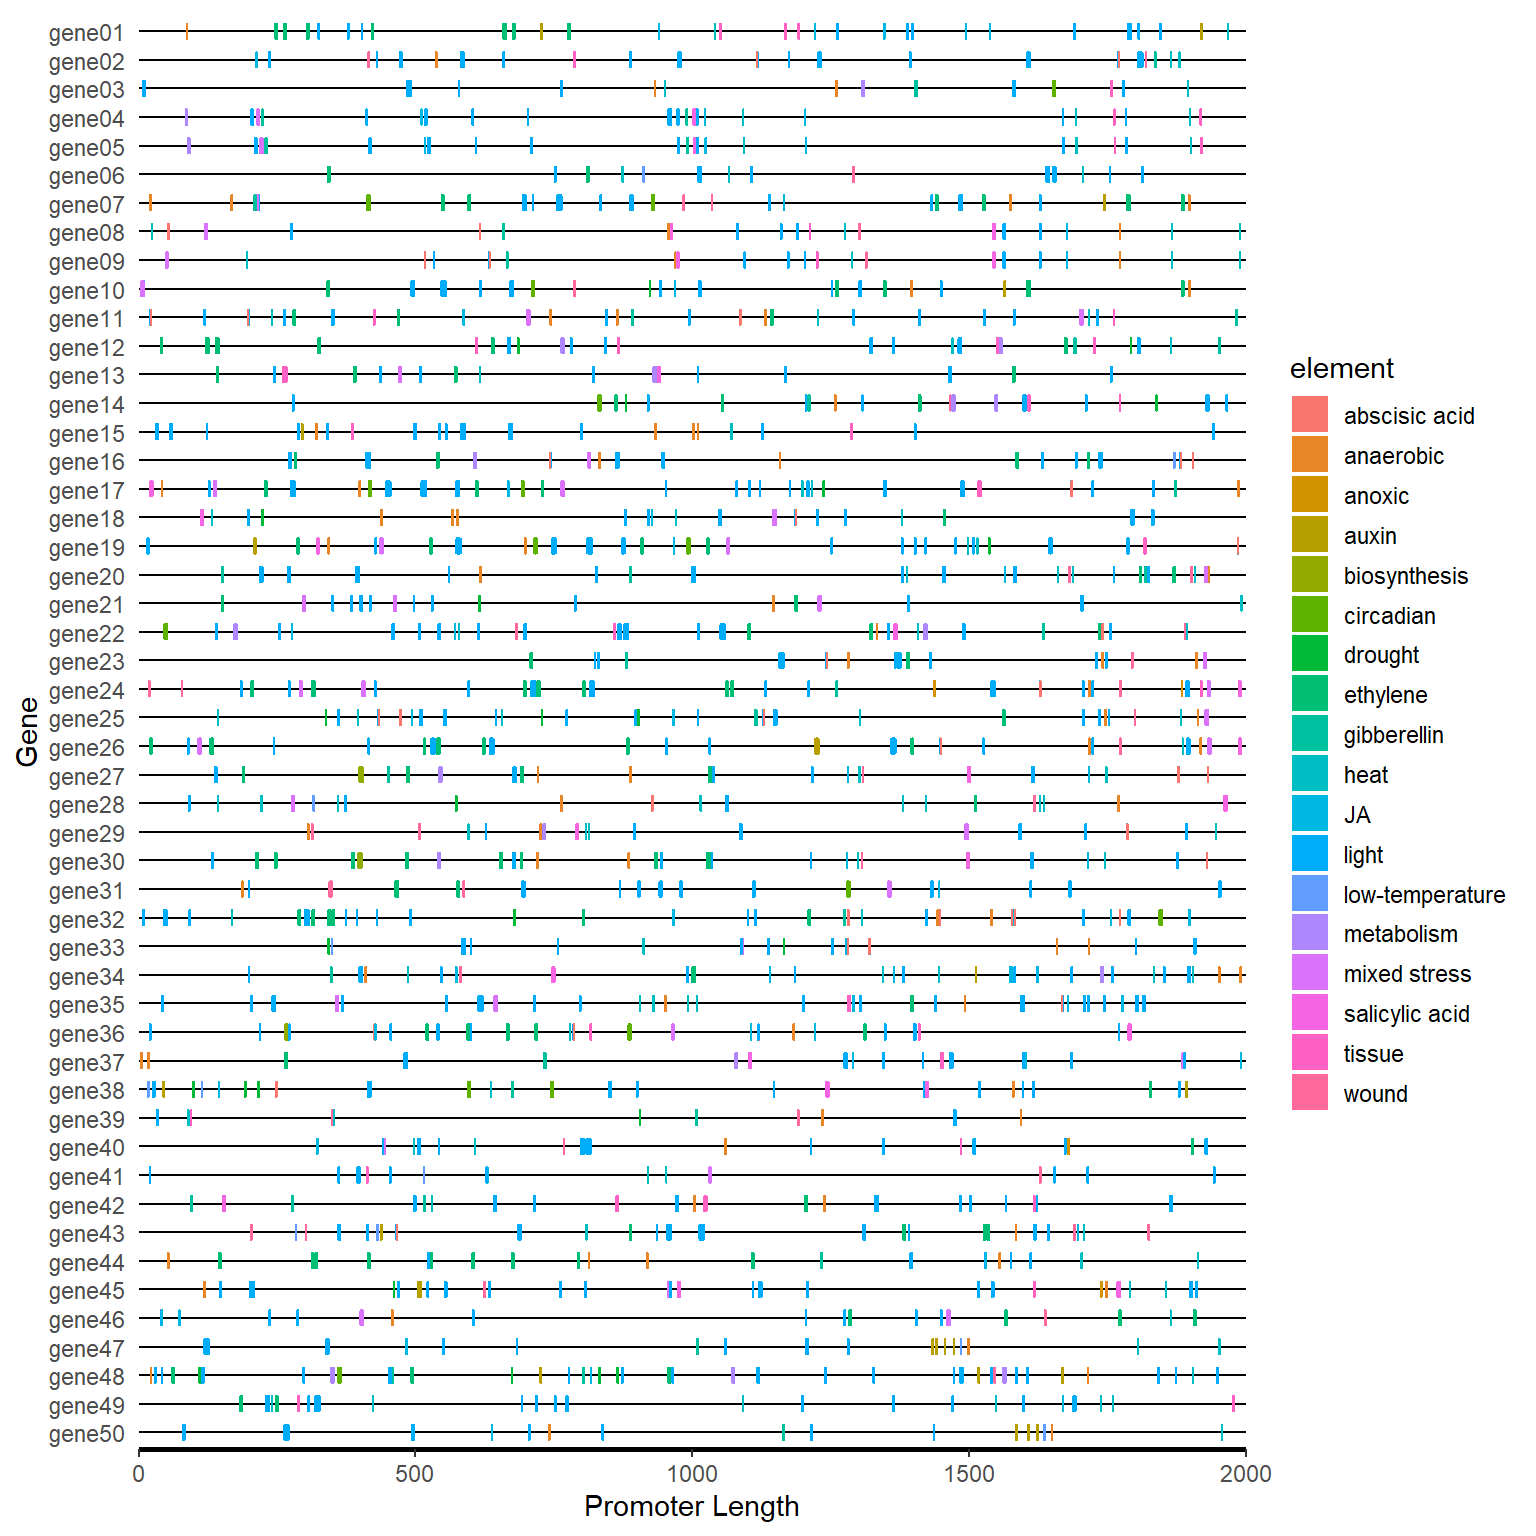
plantcare_path <- system.file("extdata", "plantCARE_output.tab", package = "BioVizSeq")
plantcare_plot(plantcare_path, promoter_length = 2000)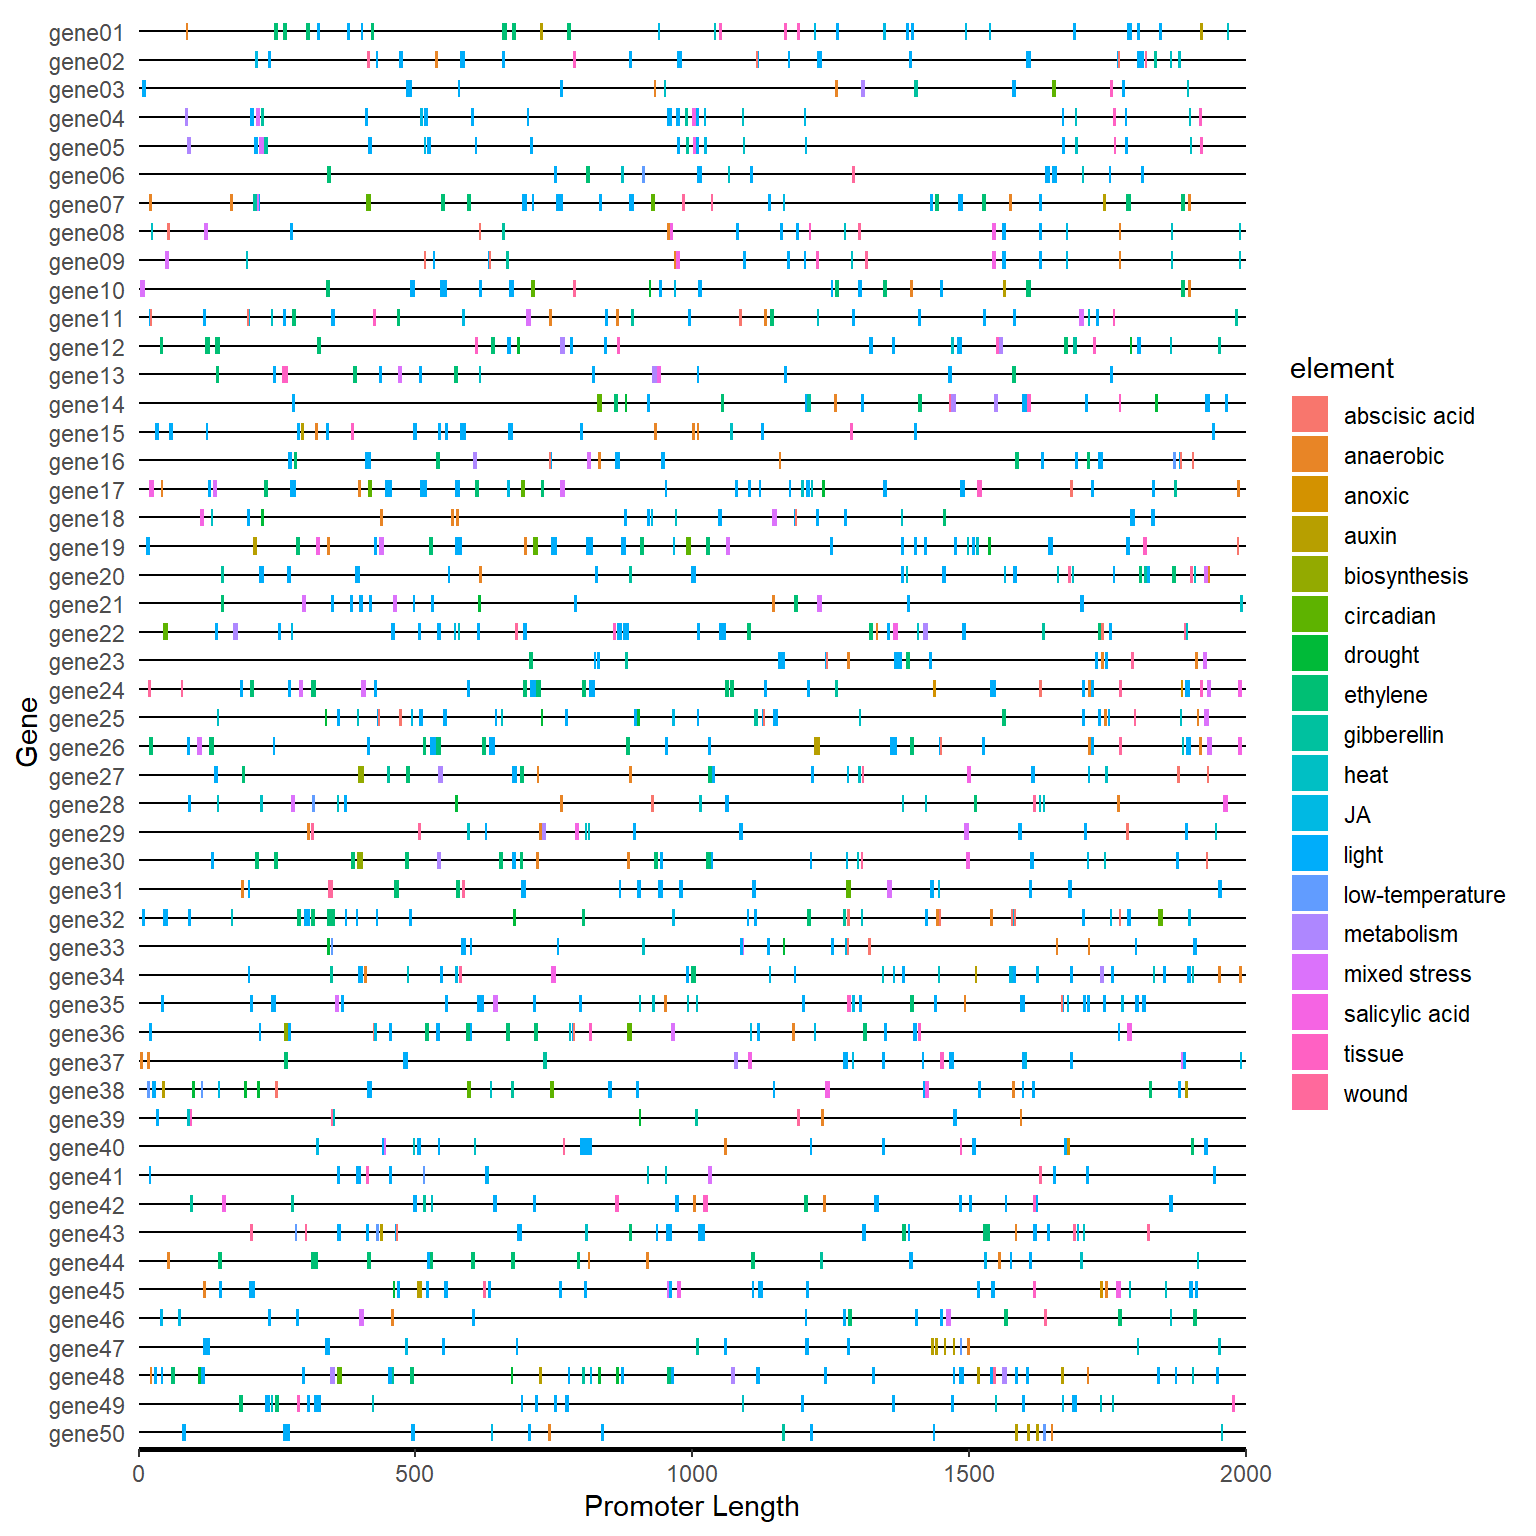
p_tree, p_gff, p_pfam, p_meme, p_smart, p_cdd, p_plantcare
library(patchwork)
tree_path <- system.file("extdata", "idpep.nwk", package = "BioVizSeq")
gff_path <- system.file("extdata", "idpro.gff3", package = "BioVizSeq")
meme_path <- system.file("extdata", "mast.xml", package = "BioVizSeq")
pfam_path <- system.file("extdata", "iprscan.tsv", package = "BioVizSeq")
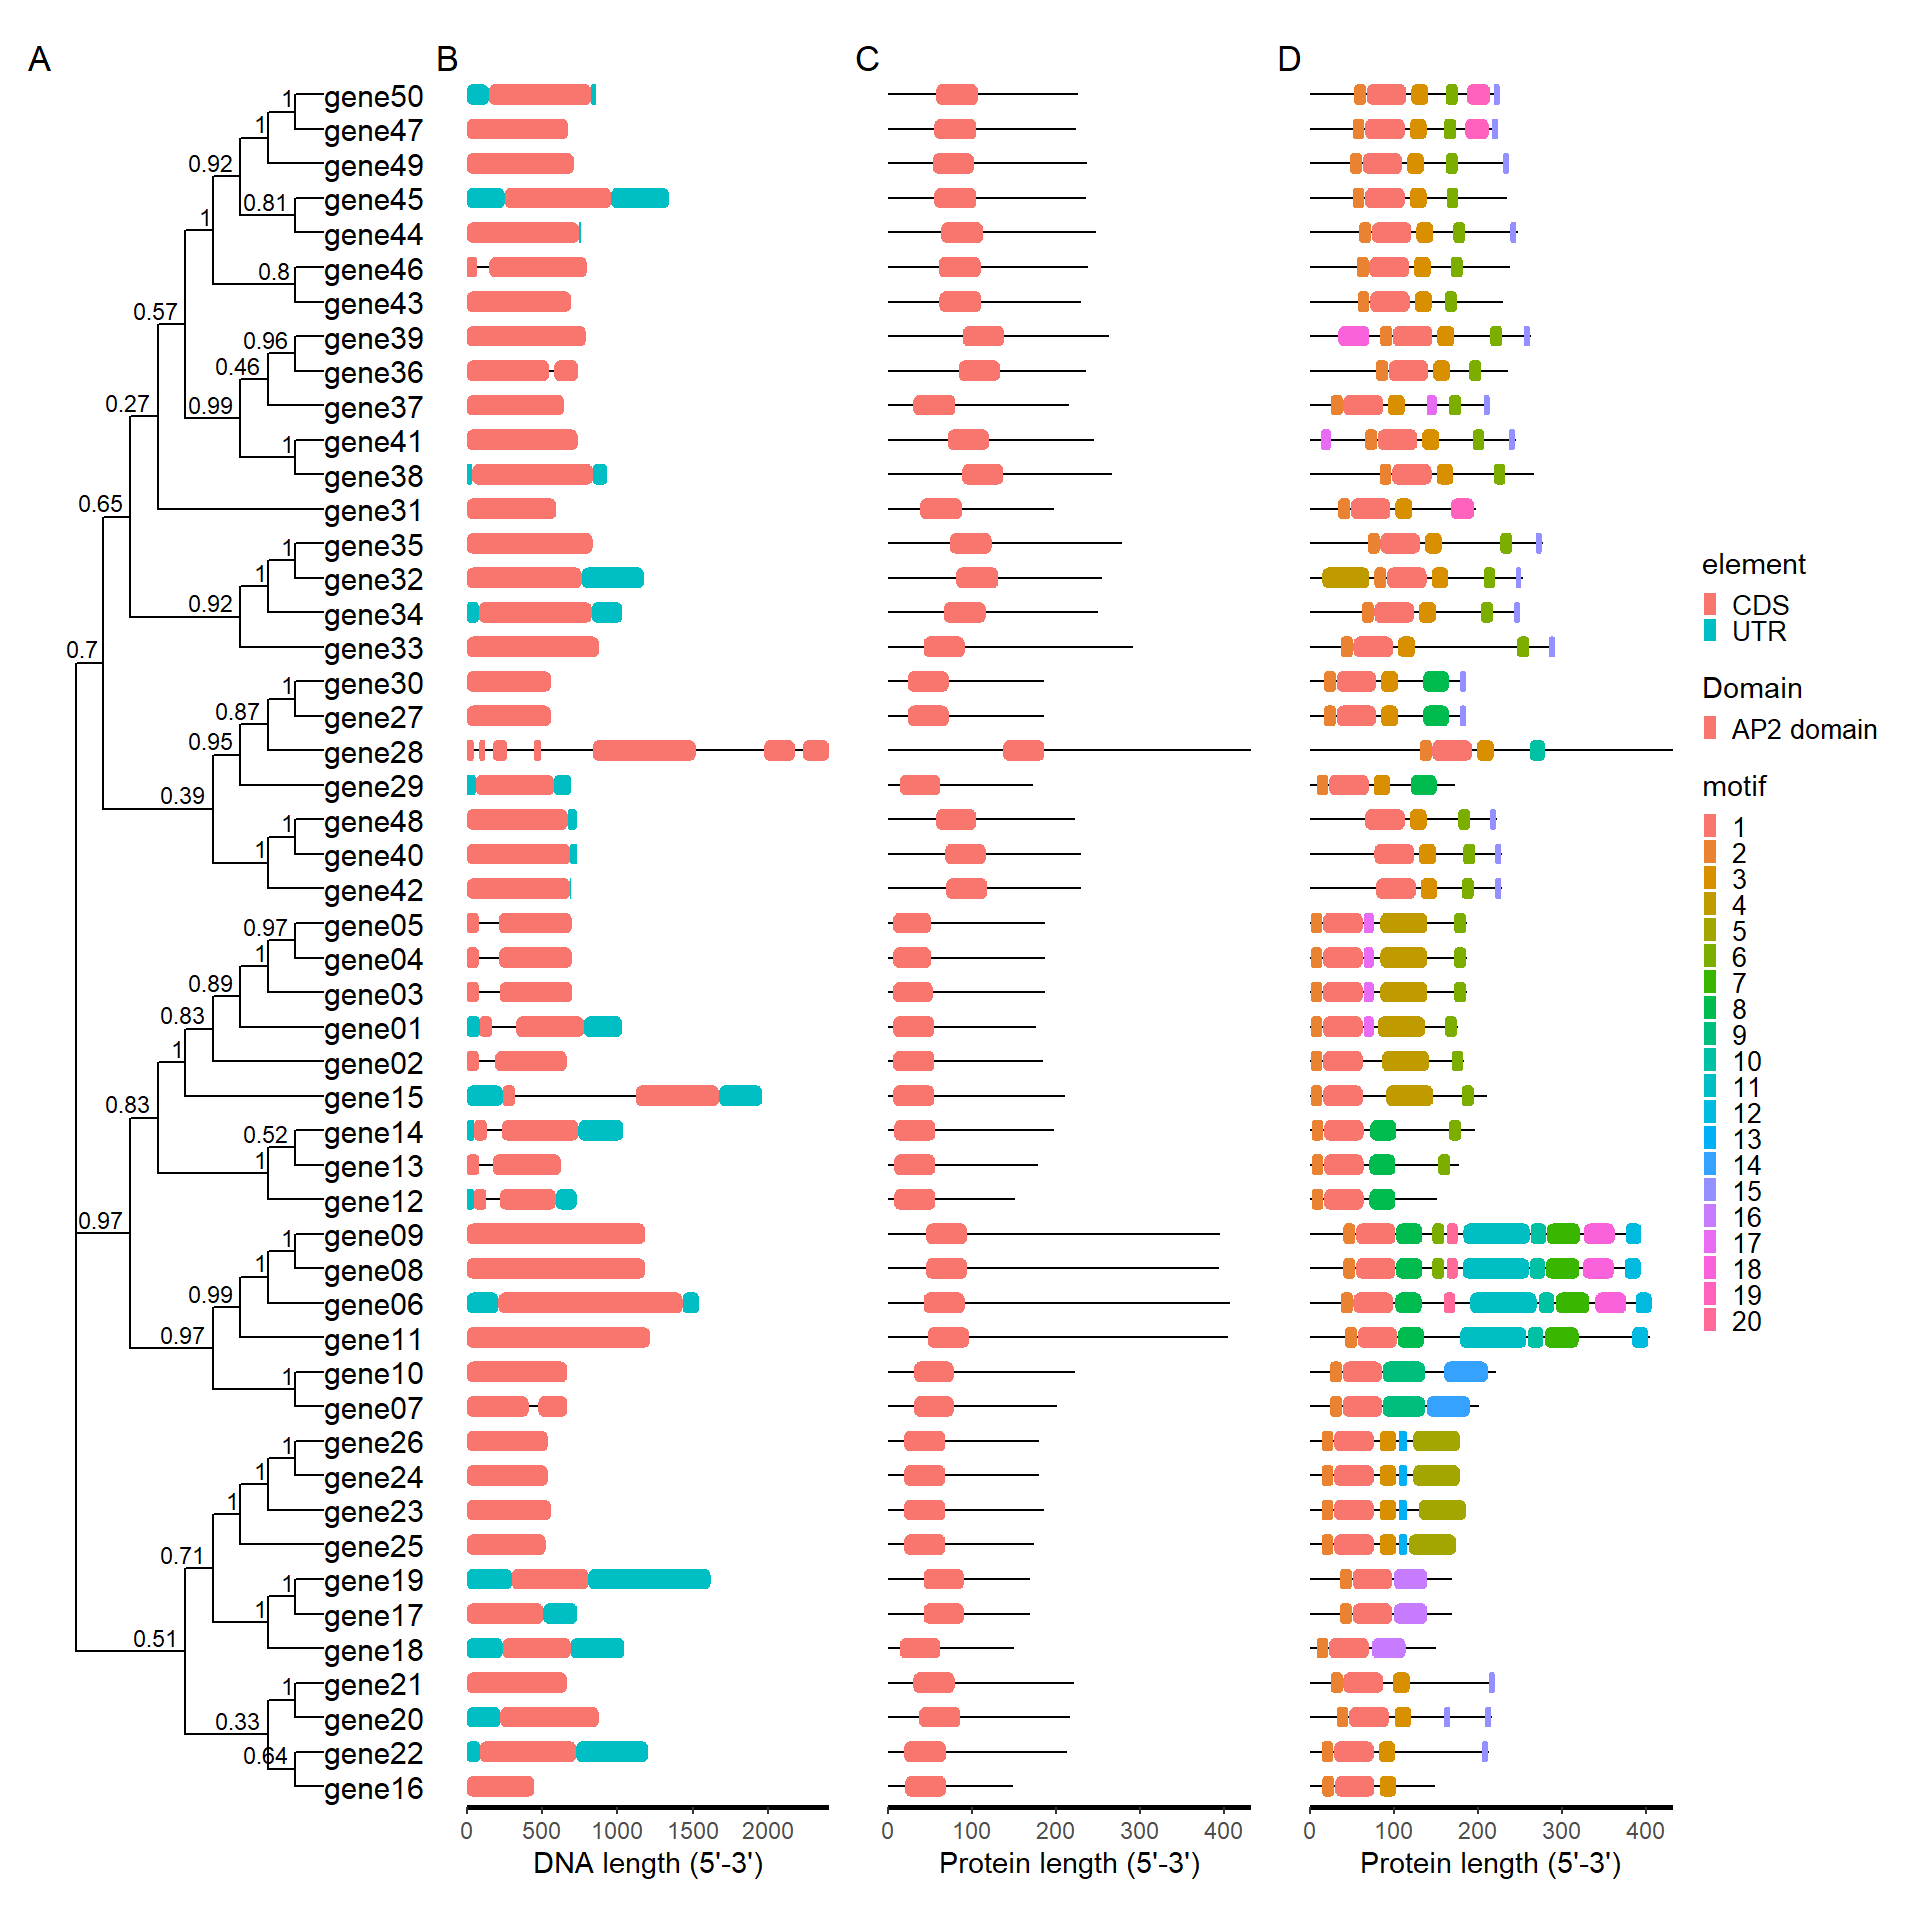
plot_file <- combi_p(tree_path = tree_path, gff_path = gff_path,
meme_path = meme_path, pfam_path = pfam_path)
plot_file$p_tree + plot_file$p_gff + plot_file$p_pfam +
plot_file$p_meme +plot_layout(ncol = 4, guides = 'collect') +
plot_annotation(
tag_levels = 'A'
)
library(patchwork)
tree_path <- system.file("extdata", "idpep.nwk", package = "BioVizSeq")
plantcare_path <- system.file("extdata", "plantCARE_output.tab", package = "BioVizSeq")
plot_file <- combi_p(tree_path = tree_path, plantcare_path = plantcare_path, promoter_length = 2000)

plot_file$p_tree + plot_file$p_plantcare1 + plot_file$p_plantcare2 + plot_layout(ncol = 3, guides = 'collect', widths = c(1, 3, 1)) + plot_annotation( tag_levels = 'A' )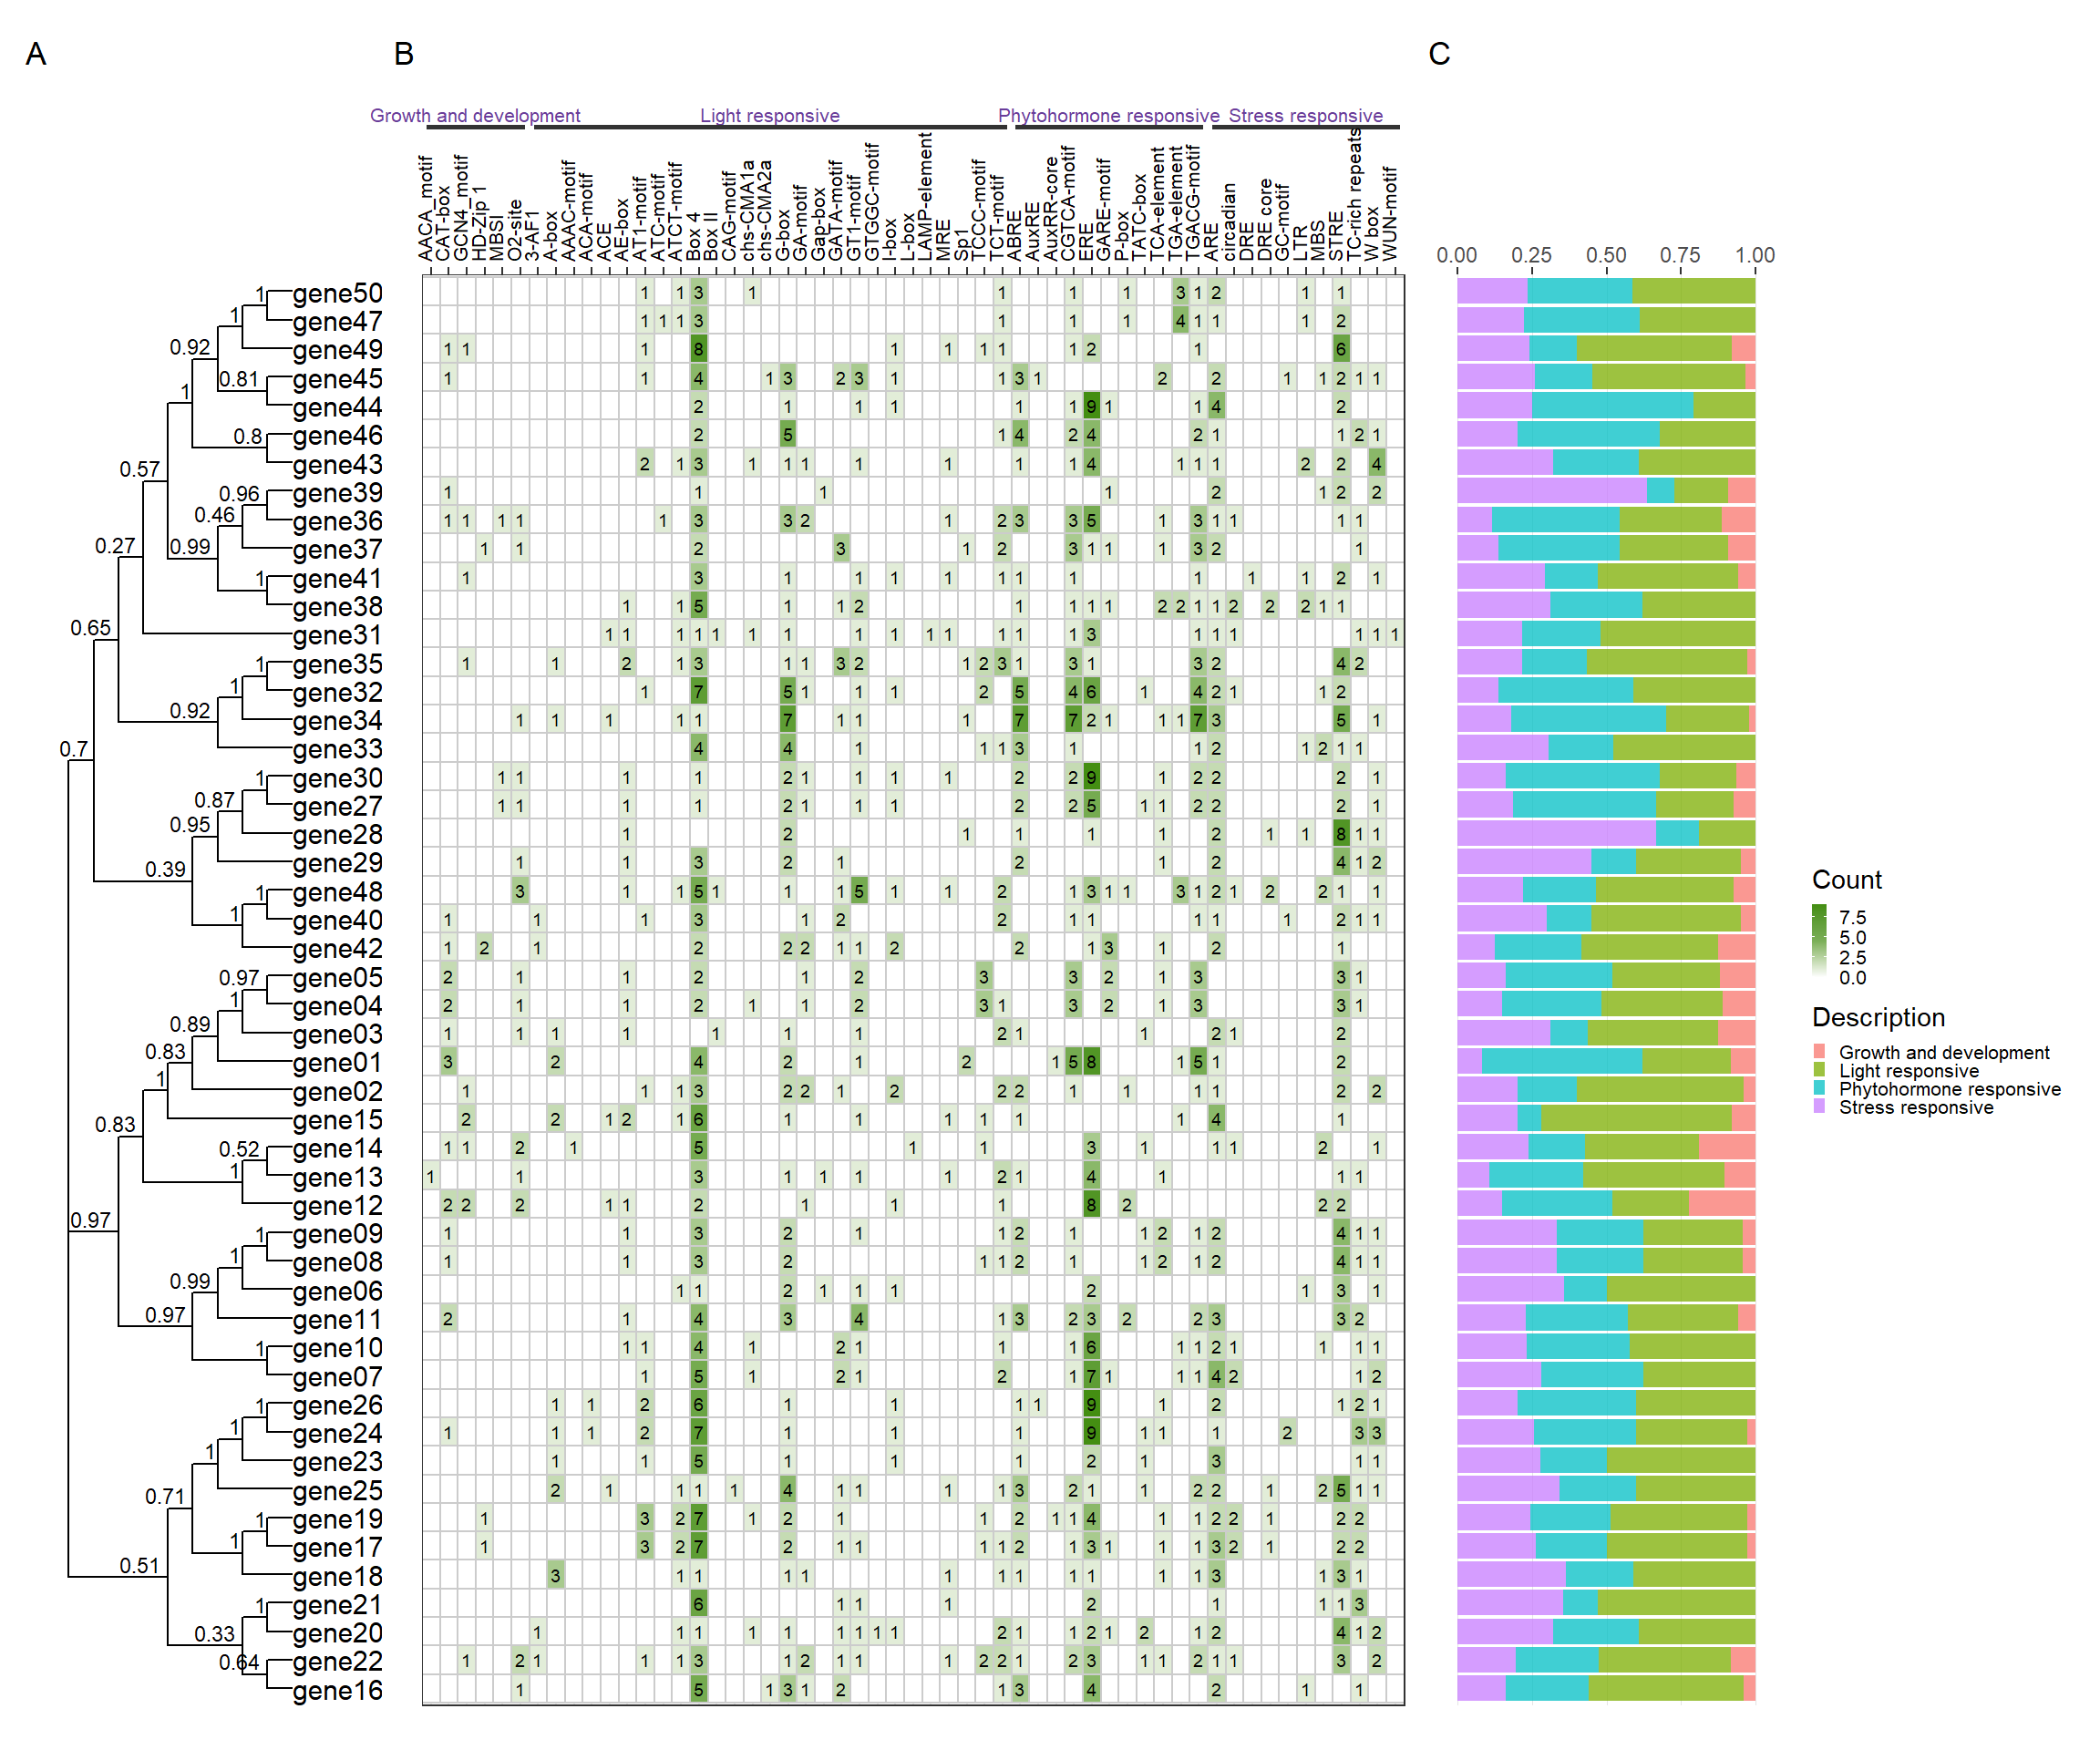
gff_path <- system.file("extdata", "idpro.gff3", package = "BioVizSeq")
gff_data <- read.table(gff_path, header = FALSE, sep = '\t')
gene_statistics_data <- gff_statistics(gff_data)
head(gene_statistics_data)
#>       ID                Location Chain gene_length CDS_length protein_length
#> 1 gene01 Chr15:31085288-31086321     -        1034        531            176
#> 2 gene02   Contig862:15967-16631     -         665        555            184
#> 3 gene03 Chr15:31004816-31005518     +         703        564            187
#> 4 gene04 Chr15:30780257-30780955     +         699        564            187
#> 5 gene05 Chr15:30976079-30976776     +         698        564            187
#> 6 gene06  Chr2:12719447-12720989     +        1543       1224            407
#>   exon_number intron_number CDS_number UTR_number
#> 1           2             1          2          2
#> 2           2             1          2          0
#> 3           2             1          2          0
#> 4           2             1          2          0
#> 5           2             1          2          0
#> 6           1             0          1          2

pep_path <- system.file("extdata", "idpep2.fa", package = "BioVizSeq")
pep_calc_result <- ProtParam_calc(pep_path)
#> Submitting sequence gene01...
#> Submitting sequence gene02...
#> Submitting sequence gene03...
head(pep_calc_result)
#>       ID Number of amino acids Molecular weight Theoretical pI
#> 1 gene01                   176         19433.92           6.22
#> 2 gene02                   184         20288.83           9.07
#> 3 gene03                   187         21042.90           7.68
#>   The instability index Aliphatic index Grand average of hydropathicity
#> 1                 80.30           67.16                          -0.611
#> 2                 68.69           73.15                          -0.580
#> 3                 72.86           69.41                          -0.637